It's this icosahedron right here: http://www.ngdc.noaa.gov/mgg/fliers/04mgg02.html
Wednesday, July 20, 2011

Wednesday, May 4, 2011
Good enough or worse than not at all
I was reminded recently of an idea mentioned in an xkcd mouseover text: to keep yourself from being distracted by crap on the internet, put a 30-second delay before opening up a new webpage. I searched and someone had wroten a little script to do that.
I don't know if I screwed something up installing it or whatever, but the script appears to work erratically: sometimes correctly, sometimes showing a countdown on its icon but not obscuring the page, and sometimes having no effect at all.
The upshot being, the anti-distraction mechanism itself ends up replicating the "slot machine" sort of dynamic that makes things like web forums, Twitter feeds, and news sites so distracting in the first place. Being able to instantly check Reddit for new stories whenever you want is habit-forming, but only being able to do so 10% of the time is even worse!
Anyway, just found that amusing or whatever.
I don't know if I screwed something up installing it or whatever, but the script appears to work erratically: sometimes correctly, sometimes showing a countdown on its icon but not obscuring the page, and sometimes having no effect at all.
The upshot being, the anti-distraction mechanism itself ends up replicating the "slot machine" sort of dynamic that makes things like web forums, Twitter feeds, and news sites so distracting in the first place. Being able to instantly check Reddit for new stories whenever you want is habit-forming, but only being able to do so 10% of the time is even worse!
Anyway, just found that amusing or whatever.
Wednesday, April 27, 2011
Celestiality
I wanted to be able to generate random but plausible celestial spheres of stars visible to the naked eye from the vantage point of a solar system like ours, situated in an arm of a spiral galaxy.

The hunk on the left is made of stars on the main sequence, and the other splotch of giants, with a spattering of others. Most of the stars around us are red dwarrows, but since they're too small and dim to see with the naked eye, I don't even care about those.
A histogram (excuse the rotation and scaled-up x-axis) looks like:

I smoothened that out to make a probability distribution (scaled up, and apologies for yet another axis rotation):

You can't see it, but outside the main globs there are big regions of "off-white" (grays 253 and 254) where there are small but nonzero probabilities of finding stars.


So pretty good! Next step (after tweaking the distance-from-galactic-plane function) would be generating some realistic views from a planet according to axial tilt and times of day and season. And then inventing constellations?
Also maybe the possibility of a perspective from outside a galactic arm? Though how likely is that, if you're looking from a class G or K main sequence star?
I don't know. I think it's cool though.
Source here, requires pygame, numpy, and matplotlib.
I grabbed all the stars in ESA's Hipparcos catalogue with apparent magnitudes below 6, which comes to a little over 5000 stars. Mapped out on a sphere according to apparent magnitude and color they look like:

That's a sinusoidal projection of the whole sphere, as would be seen from inside of it (on the Earth, for example). I sanity-checked it by filtering out all but the stars of the Big Dipper and made sure it dipped in the right orientation and hemisphere.
Plotting their absolute magnitudes versus their color index looks like this:
That's a sinusoidal projection of the whole sphere, as would be seen from inside of it (on the Earth, for example). I sanity-checked it by filtering out all but the stars of the Big Dipper and made sure it dipped in the right orientation and hemisphere.
Plotting their absolute magnitudes versus their color index looks like this:

The hunk on the left is made of stars on the main sequence, and the other splotch of giants, with a spattering of others. Most of the stars around us are red dwarrows, but since they're too small and dim to see with the naked eye, I don't even care about those.
A histogram (excuse the rotation and scaled-up x-axis) looks like:

I smoothened that out to make a probability distribution (scaled up, and apologies for yet another axis rotation):
You can't see it, but outside the main globs there are big regions of "off-white" (grays 253 and 254) where there are small but nonzero probabilities of finding stars.
One thing I had not expected was that even without rendering a "milky way," the visible stars are noticeably more prevalent closer to the galactic disk. So I also found a best fit great circle and recorded each star's angular distance from that. Plotting those on the z-axis gives:

You sort of need to move it around to tell what's going on, but basically stars are more likely to be near the disk, and more so if they're brighter and whiter. I didn't even try to quantify this any better, just fudged it.
So I generate 6000 (or however many) stars with color and magnitude selected according to my smoothified histogram. Each star gets a random distance within visibility range (because my initial sample only included stars of a given color close enough to be visible to the naked eye, I can't create any too far away to see without throwing off the distribution) and is either randomly rotated away from the galactic plane or rotated according to a normal distribution, more likely the latter the brighter and whiter it is.
Results shown on the right, alongside plots of the Hipparcos data set on the left (and as shown above).
Results shown on the right, alongside plots of the Hipparcos data set on the left (and as shown above).

The results aren't too bad, though that lowest-probability shade in my smootherized histogram is too dark: it should probably be like gray 254.9 or something.
Finally the whole thing gets a random rotation from the galactic plane, and the results might look something like this:
So pretty good! Next step (after tweaking the distance-from-galactic-plane function) would be generating some realistic views from a planet according to axial tilt and times of day and season. And then inventing constellations?
Also maybe the possibility of a perspective from outside a galactic arm? Though how likely is that, if you're looking from a class G or K main sequence star?
I don't know. I think it's cool though.
Source here, requires pygame, numpy, and matplotlib.
Saturday, April 23, 2011

Thursday, April 7, 2011
Software Idea
You enter the ingredients list and nutritional information of a food product, like what's printed on the package. The system looks up the nutritional data for each individual ingredient. That information, plus the inequalities implied by the order of the ingredients list, allows it to solve for the relative quantities of each ingredient (giving ranges where an exact amount can't be determined, such as for ingredients with no measured nutritional value).
Basically I want to reverse engineer this here granola.
Basically I want to reverse engineer this here granola.
Sunday, February 13, 2011
Tuesday, January 11, 2011
Thursday, November 11, 2010
Obama the Leftist
Righteous rant from Kevin Carson:
Obama lied when he said, "There is not a rich America, and a poor America…. We are one nation, one people."
...
The Iraqi worker is my fellow countryman. The American plutocrat is my enemy.
Wednesday, November 3, 2010
Hate This
I love bike lanes, but this shrill denunciation of people parking in bike lanes during church is ridiculous: it's Sunday morning; you're not commuting; and church aside traffic is generally light. So just grow a pair and take the damn lane.
In addition, cycling advocates are done no favors by spandexed hobbyists exhorting cops to write parking tickets to old ladies in church hats. Bike lanes should be about safe transportation infrastructure, not staking out territory for yuppies.
Saturday, October 30, 2010
Polygons on a Sphere
It's this shape:

And a couple of instances of them go around a sphere in different directions (the blue dot shows the orientation, which is different from the direction of travel, and the red dot is the centroid):
![]()
Far from the center of the projection, they get distorted:

When one wraps around to the other side of the projection it gets all screwy, but I couldn't get a screen cap.
Same repository as last time, now additionally depends on Shapely.
And a couple of instances of them go around a sphere in different directions (the blue dot shows the orientation, which is different from the direction of travel, and the red dot is the centroid):

Far from the center of the projection, they get distorted:

When one wraps around to the other side of the projection it gets all screwy, but I couldn't get a screen cap.
Same repository as last time, now additionally depends on Shapely.
Wednesday, October 20, 2010
Weak
Contra xkcd, I'm sure thousands of corporations are helmed by people who seek guidance in prayer, horoscopes, tarot, &c. and doing just fine.
Most of these ideas don't even theoretically make sense ("health care cost reduction" isn't a market anyone can "make a killing in," which is why governments have to step in; I believe remote viewing is supposed to require people at the remote location; if the military were using hexes then they would probably keep quiet about it, and they have certainly at least tried it; and I don't think anybody would expect "crystal energy" to be energy in the sense of the physics term "energy").
And in any case, just because "capitalism" is "profit-focused" doesn't mean that individual firms succeed in discovering every possible path towards maximizing profits. Ruthlessness doesn't imply omniscience.
Most of these ideas don't even theoretically make sense ("health care cost reduction" isn't a market anyone can "make a killing in," which is why governments have to step in; I believe remote viewing is supposed to require people at the remote location; if the military were using hexes then they would probably keep quiet about it, and they have certainly at least tried it; and I don't think anybody would expect "crystal energy" to be energy in the sense of the physics term "energy").
And in any case, just because "capitalism" is "profit-focused" doesn't mean that individual firms succeed in discovering every possible path towards maximizing profits. Ruthlessness doesn't imply omniscience.
Tuesday, October 19, 2010
Dollar? I never even &c.
Via Atrios, I knew that it was widely believed that the US would not act to devalue the dollar, but I was also under the impression that the context of that position was that, while a falling dollar would be (potentially) beneficial to our economy, there are some number of reasons against trying to pursue those ends. I didn't realize Geithner's position was actually in the opposite direction, that we need to do all we can to strengthen the dollar.
I mean fair enough, some people are in the "let's try anything" camp while others are more towards the "let's not mess with anything and see how it shakes out" side of things. "Let's take whatever people in the 'try anything' camp suggest and run in the opposite direction" seems so pointlessly sadistic as to be off the reservation entirely.
You camp on a reservation right.
I mean fair enough, some people are in the "let's try anything" camp while others are more towards the "let's not mess with anything and see how it shakes out" side of things. "Let's take whatever people in the 'try anything' camp suggest and run in the opposite direction" seems so pointlessly sadistic as to be off the reservation entirely.
You camp on a reservation right.
Sunday, October 10, 2010
Livin' on a Sphere
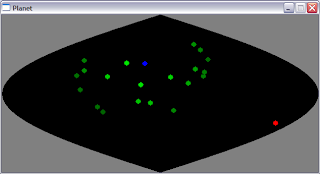
I've been mucking about trying to get something that looks something like what's described here, but on the surface of a sphere (not about to try modeling any kind of actual fluid dynamics, just trying to mimic the behavior).
I used a sinusoidal projection so each screen pixel represents about the same area of the sphere. It took me way too long to figure out I should be using regular old vectors in R3 instead of muddling through with latitudes and longitudes.
Brighter green points are heavier, and the blue point is their weighted average. The red point repels the green points and moves to the blue point whenever the green ones slow down sufficiently.
So this is early in a cycle, when the red point has recently moved to the weighted average location:

And this is later on in a (later) cycle, as the repelled points are converging towards the antipode:
Source here ("Heat2.py" is shown, but there's other related crap in there), requires Numpy and pygame.
I used a sinusoidal projection so each screen pixel represents about the same area of the sphere. It took me way too long to figure out I should be using regular old vectors in R3 instead of muddling through with latitudes and longitudes.
Brighter green points are heavier, and the blue point is their weighted average. The red point repels the green points and moves to the blue point whenever the green ones slow down sufficiently.
So this is early in a cycle, when the red point has recently moved to the weighted average location:

And this is later on in a (later) cycle, as the repelled points are converging towards the antipode:

Source here ("Heat2.py" is shown, but there's other related crap in there), requires Numpy and pygame.
Saturday, October 9, 2010
Preview of my Master's Thesis
The phrase "I am not a human being" is a restatement of "no homo," QED, I rest my case, nullus.
Thursday, October 7, 2010
The Means are the Ends
Ezra can't understand why anyone would want to require people to pass a drug test to collect unemployment: but it's not about the drugs, it's about the test itself, and making people submit to it.
The proposed policy differs from Carl Paladino's proposal to put welfare recipients in prison in degree rather than kind. There is no rational motivation, no goal to be accomplished, beyond the stigmatization and restriction of liberty imposed by the enforcement mechanism itself.
It's also blatantly unconstitutional, but when has that ever stopped the police state.
The proposed policy differs from Carl Paladino's proposal to put welfare recipients in prison in degree rather than kind. There is no rational motivation, no goal to be accomplished, beyond the stigmatization and restriction of liberty imposed by the enforcement mechanism itself.
It's also blatantly unconstitutional, but when has that ever stopped the police state.
Saturday, October 2, 2010
Out of Comptrol
I didn't know that
- "controller" comes from "counter roller," meaning I guess that "to control" comes from "to counter-roll";
- "comptroller" is a misspelling of the same word, "born of ignorance and continued in darkness" (that's what she said); and
- the "P" is silent.
Wednesday, September 29, 2010
Questions for the Anti-Vaccination Community
- Sometimes adults have to get a new immune system and so they get their vaccinations again. But they never go autistic, AFAIK.
- Pets (dogs and cats, possibly ferrets in some places) get vaccinations. How come they never turn autistic? Retarded yes, but not autistic.
- QED, I rest my case.
More Dorkiness
I've adapted the code from the other day to use real-valued characteristics, the Euclidean distance in characteristic space representing the probability of agents interacting. And I added some histograms to the display:

They converge on a wishy-washy moderate consensus pretty quickly, so there's a distance threshold in there to keep everything from joining together right away:

Source here.

They converge on a wishy-washy moderate consensus pretty quickly, so there's a distance threshold in there to keep everything from joining together right away:

Source here.
Monday, September 27, 2010
Your Ways Are Numbered
Have been thinking lately about simulating how cultural values change in a population.1
The general approach I was considering was an agent-based model where each agent's "values" are represented by a set of n real numbers in [0,1]: basically each dimension is like one of those survey questions that's a statement like "everyone should have access to clean drinking water," with answers ranging from "strongly disagree" to "strongly agree," and "neutral" in the middle (0.5).
And when two agents had a lot in common with one another values-wise (i.e., were nearby in n-dimensional space), then they would be more likely to move closer together. So starting with a randomly generated population, you'd see different subgroups start to coalesce into one or more distinct cultures with shared values (and eventually reducing to a single consensus culture if the simulation ran long enough).
Which as I poked around looked a lot like what was done in this 1997 paper (PDF) by Robert Axelrod (nullus), The Dissemination (nullus) of Culture. He puts his agents on a grid and only lets them potentially interact with grid neighbors. It's neat.
Here's a Python implementation, with visualization in PyGame (I inverted Axelrod's color coding so more similar sites are connected by darker lines, which strikes me as more intuitive):
1 For extremely nerdy reasons.
The general approach I was considering was an agent-based model where each agent's "values" are represented by a set of n real numbers in [0,1]: basically each dimension is like one of those survey questions that's a statement like "everyone should have access to clean drinking water," with answers ranging from "strongly disagree" to "strongly agree," and "neutral" in the middle (0.5).
And when two agents had a lot in common with one another values-wise (i.e., were nearby in n-dimensional space), then they would be more likely to move closer together. So starting with a randomly generated population, you'd see different subgroups start to coalesce into one or more distinct cultures with shared values (and eventually reducing to a single consensus culture if the simulation ran long enough).
Which as I poked around looked a lot like what was done in this 1997 paper (PDF) by Robert Axelrod (nullus), The Dissemination (nullus) of Culture. He puts his agents on a grid and only lets them potentially interact with grid neighbors. It's neat.
Here's a Python implementation, with visualization in PyGame (I inverted Axelrod's color coding so more similar sites are connected by darker lines, which strikes me as more intuitive):
import random

import pygame
from pygame.locals import *

class Simulation:

    WIDTH = 640
    HEIGHT = 480

    LINE = 4

    DRAW_FRAMES = 1000

    def __init__(self, dimensions):
        self.dimensions = dimensions
        self.grid_size = min(self.WIDTH/(self.dimensions[0] + 1),
                             self.HEIGHT/(self.dimensions[1] + 1))
        self.bg_rect = pygame.Rect(max(0, (self.WIDTH - (self.dimensions[0] + 1) * self.grid_size) / 2),
                                   max(0, (self.HEIGHT - (self.dimensions[1] + 1) * self.grid_size) / 2),
                                   (self.dimensions[0] + 1) * self.grid_size,
                                   (self.dimensions[1] + 1) * self.grid_size)

        self.sites = [[[random.randint(1,10) for i in range(5)]
                       for y in range(self.dimensions[1])]
                      for x in range(self.dimensions[0])]

    def background(self, screen):
        screen.fill((255,255,255), self.bg_rect)

    def similarity(self, p1, p2):
        return sum(c1 == c2 for c1, c2 in zip(p1, p2))/float(len(p1))

    def color(self, p1, p2):
        gray = 255 - int(self.similarity(p1, p2) * 255)
        return (gray, gray, gray)

    def lines(self, screen):
        for x in range(self.dimensions[0]):
            for y in range(self.dimensions[1]):
                start = (self.bg_rect.left + (x+1) * self.grid_size,
                         self.bg_rect.top + (y+1) * self.grid_size)
                if x < self.dimensions[0] - 1:
                    end = (start[0] + self.grid_size, start[1])
                    color = self.color(self.sites[x][y], self.sites[x+1][y])
                    pygame.draw.line(screen, color, start, end, self.LINE)
                if y < self.dimensions[1] - 1:
                    end = (start[0], start[1] + self.grid_size)
                    color = self.color(self.sites[x][y], self.sites[x][y+1])
                    pygame.draw.line(screen, color, start, end, self.LINE)

    def random_site(self):
        return (random.randint(0, len(self.sites)-1),
                random.randint(0, len(self.sites[0])-1))

    def random_neighbor(self, site):
        x,y = site
        neighbors = []
        if x > 0:
            neighbors.append((x-1,y))
        if x < len(self.sites)-1:
            neighbors.append((x+1,y))
        if y > 0:
            neighbors.append((x,y-1))
        if y < len(self.sites[0])-1:
            neighbors.append((x,y+1))
        return random.sample(neighbors, 1)[0]

    def interact(self, active, neighb):
        different = [i for i in range(len(active))
                     if active[i] != neighb[i]]
        if len(different) > 0:
            i = random.sample(different, 1)[0]
            active[i] = neighb[i]

    def try_event(self):
        active = self.random_site()
        neighb = self.random_neighbor(active)
        active_site = self.sites[active[0]][active[1]]
        neighb_site = self.sites[neighb[0]][neighb[1]]
        if random.random() < self.similarity(active_site, neighb_site):
            self.interact(active_site, neighb_site)

    def run(self):
        pygame.init()

        screen = pygame.display.set_mode((self.WIDTH,self.HEIGHT), HWSURFACE)
        pygame.display.set_caption('Sites')

        done = False
        n = 0
        while not done:
            for event in pygame.event.get():
                if event.type == QUIT:
                    done = True
                elif event.type == KEYDOWN:
                    if event.key == K_ESCAPE:
                        done = True

            self.try_event()
            n += 1
            if n > self.DRAW_FRAMES:

                self.background(screen)
                self.lines(screen)

                pygame.display.flip()

                n = 0

if __name__ == '__main__':
    Simulation((10,10)).run()
1 For extremely nerdy reasons.
Thursday, September 23, 2010
Recaps off to ya!
I thought Dave was about to go in a different direction when he cut down recapping television.
I hate to have to point this out, but while Mr. Delahaye attacks a blogger for "compar[ing] [them]sel[ves] to DERRIDA and BARTHES" (his caps), the quoted party he's rebutting actually makes a point of saying that he means "not to compare [him]self to anybody" (emphasis mine).
He rests his case, I'm sure.
But my real objection is that actually recapping is pretty interesting as a genre: it's something of such obviously little value that it only could have found a foothold in a digital context, and yet it evidently has enough appeal that there are not only sites devoted entirely to recapping that manage to scrape by, but there are more than a few non-recap sites that include recaps nonetheless to bolster their hit stats.
And from what I've seen of recaps (and as the Observer piece appeared to be arguing), the more popular ones tend to be not just plays-by-play of television episodes' plots, but rather those that delve into analysis and deconstruction of the sort which I believe Derrida would approve.
The story of television recaps on the internet is that in a medium without (as many) gatekeepers, there exists a public appetite for analyzing popular culture, an appetite that is largely unanticipated and wholly unsatisfied by the corporate producers of said culture.
I hate to have to point this out, but while Mr. Delahaye attacks a blogger for "compar[ing] [them]sel[ves] to DERRIDA and BARTHES" (his caps), the quoted party he's rebutting actually makes a point of saying that he means "not to compare [him]self to anybody" (emphasis mine).
He rests his case, I'm sure.
But my real objection is that actually recapping is pretty interesting as a genre: it's something of such obviously little value that it only could have found a foothold in a digital context, and yet it evidently has enough appeal that there are not only sites devoted entirely to recapping that manage to scrape by, but there are more than a few non-recap sites that include recaps nonetheless to bolster their hit stats.
And from what I've seen of recaps (and as the Observer piece appeared to be arguing), the more popular ones tend to be not just plays-by-play of television episodes' plots, but rather those that delve into analysis and deconstruction of the sort which I believe Derrida would approve.
The story of television recaps on the internet is that in a medium without (as many) gatekeepers, there exists a public appetite for analyzing popular culture, an appetite that is largely unanticipated and wholly unsatisfied by the corporate producers of said culture.
Subscribe to:
Posts (Atom)